Skip to content
Peter Jordan

Peter Jordan

Digital strategist with a focus on digital analytics, performance analysis and findability. Thoughts, stories and ideas.

Menu

  • Digital
  • Walking
  • About Peter Jordan
  • Privacy and cookies policy

Digital

Le prix de grande vitesse

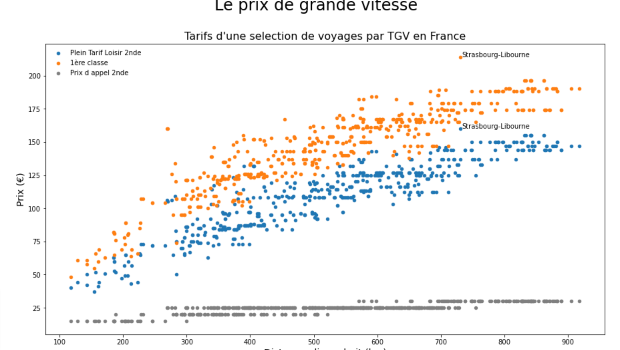
Scatterplot of tariffs for a selection of journeys by TGV in France. Prix d'Appel seconde, Plein Tarif Loisir seconde and Première classe. Also showing the most expensive and cheapest prices.

Back in October Tom Forth tweeted about the rich amount of open data published by SNCF, compared to railways in Britain, and seemingly quickly produced the chart below, comparing tariffs vs distance in France: To extend my Python skills I

Peter Jordan 22 November, 202122 November, 2021 Digital, python No Comments Read more

Performance analyst / Product Analyst?

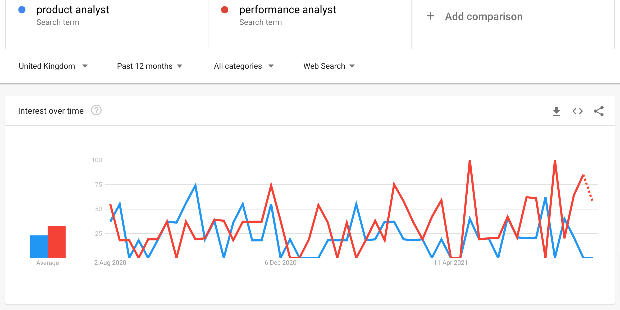
Line graph showing popularity of search terms from Google trends: product analyst and performance analyst.

I enjoyed reading Kate Gallo’s overview of the role of Product Analysts. It caused me to reflect on work I did regarding very similar roles when I was the Head of Performance and Data Analysis at the UK Government Digital

Peter Jordan 2 August, 202110 November, 2021 analytics, Digital No Comments Read more

Digital multi-hyphenates

Digital multi-hyphenates

Matt Jukes’ recent post on Multi-hyphenates got a lot of comments on Twitter and certainly struck a note with me. Like Matt, I started my ‘digital’ journey in an earlier era. I started running a University website with Microsoft FrontPage,

Peter Jordan 15 February, 20204 January, 2021 team Read more

Slow Ways hack day

Screen shot of an online Ordnance Survey map showing a footpath route from Bardney westwards to Lincoln

On 1 February, a sunny Saturday, I travelled to Clerkenwell to join 60 or 70 other volunteers on a hack day. We were there to start identifying and mapping walking routes between Britain’s towns and cities. There are over 200,000

Peter Jordan 2 February, 20204 January, 2021 mapping, walking Read more

Some thoughts on data and smart analytics

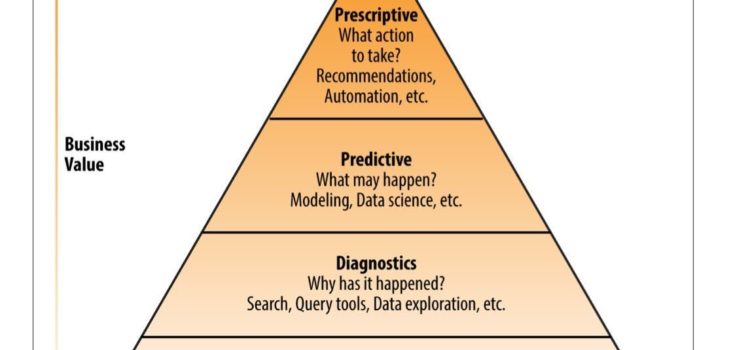
Analytics value escalator showing from bottom of pyramid to top: lowest value descriptive analytics, then diagnostic analytics, then predicitive analytics and at the top, with the highest value, predictive analytics

I was asked to do some briefing notes about data and smart analytics for a strategy paper. I thought I’d share them here. High-quality government data is important for: measuring government effectiveness holding government to account helping private, public and

Peter Jordan 19 March, 20192 August, 2021 analytics, open data Read more

GP patient numbers in Winchester and open data

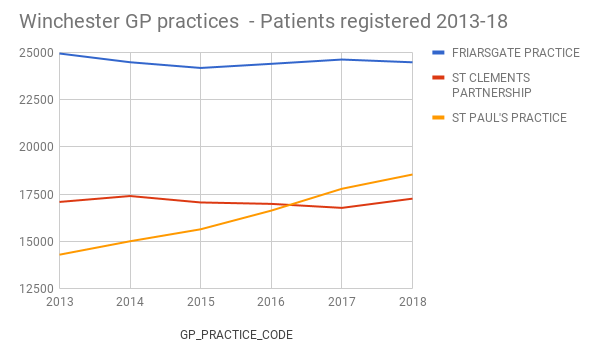
Chart showing patients registered at the 3 Winchester GP practice: ,Friarsgate, St Clements and St Paul's. Shows St Paul's has overtaken St Clement's

My GP’s surgery, St Paul’s in Winchester, has an adjacent pharmacy and small private car park. It’s always been very busy, but recently I’ve found myself queuing to get a place. It got me thinking – has my surgery actually

Peter Jordan 2 April, 20188 January, 2021 open data Read more

Being more precise about date formats

Being more precise about date formats

I’ve been working with Data Studio today and realised it interprets dates a bit more strictly than charts in Sheets. I thought I’d share what I did – and its reminder to pay more attention to managing date formats. Firstly,

Peter Jordan 9 March, 20184 January, 2021 data visualisation Read more

Industry standards for measuring websites

Industry standards for measuring websites

So what’s best practice for measuring websites and their impact – especially public sector sites? I’ve recently been doing some research about useful published standards for measuring the effectiveness of websites, particularly those in the public sector that don’t have

Peter Jordan 25 February, 20184 January, 2021 analytics, measurement Read more

An analytical response to ‘Facing things as they are’

Will Myddleton recently posted about Facing things as they are — as a fundamental of user research and an approach to life. As an analyst and as a meditator who works (sometimes successfully) to appreciate the moment, I really valued what Will

Peter Jordan 27 August, 20174 January, 2021 analytics, user research Read more

A multidisciplinary team

Two men and two women standing at a white wall

I’ve just read a recent article in the Economic View section of the New York Times. The article asks What if Sociologists Had as Much Influence as Economists? I liked the quotation from Michèle Lamont, a Harvard sociologist and president of the American

Peter Jordan 30 March, 20174 January, 2021 team Read more

Recent Posts

  • Le prix de grande vitesse
    Le prix de grande vitesse
    22 November, 2021
  • Performance analyst / Product Analyst?
    Performance analyst / Product Analyst?
    2 August, 2021
  • Digital multi-hyphenates
    Digital multi-hyphenates
    15 February, 2020
  • Some thoughts on data and smart analytics
    Some thoughts on data and smart analytics
    19 March, 2019
  • GP patient numbers in Winchester and open data
    GP patient numbers in Winchester and open data
    2 April, 2018

Categories

  • analytics
  • data visualisation
  • Digital
  • mapping
  • measurement
  • open data
  • python
  • team
  • user research

Archives

  • November 2021
  • August 2021
  • October 2020
  • September 2020
  • August 2020
  • July 2020
  • February 2020
  • March 2019
  • April 2018
  • March 2018
  • February 2018
  • August 2017
  • March 2017
  • Online lisinopril prescription
  • How to buy cheap paxil online
  • Where to buy generic norvir
  • Generic amoxil online
  • Buy metformin over the counter
  • Ventolin for sale online
  • How to get prescribed coreg
  • How to get casodex
  • Cheap prograf canada
  • Paxil cr 12.5 mg price in india
Copyright © 2023 Peter Jordan. All rights reserved. Theme Spacious by ThemeGrill. Powered by: WordPress.