
I’ve been working with Data Studio today and realised it interprets dates a bit more strictly than charts in Sheets. I thought I’d share what I did – and its reminder to pay more attention to managing date formats.
Firstly, I had a simple table of dates and a value for each month. In Google sheets, I’d used a *dd/mm/yyyy* formatted date which I have displayed as, for example, **Mar 16**.
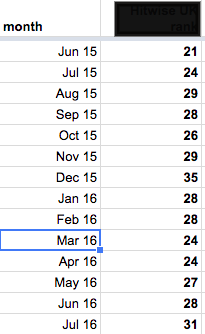
Date and value table
Linking this sheet to Data Studio, I found, not surprisingly, that the dates were displayed back as a full *dd/mm/yy* format and that some days and months were switched.
A simple reformat of the dates to *yyyymm* fixed this issue. This allowed Data Studio to interpret and display the dates correctly:
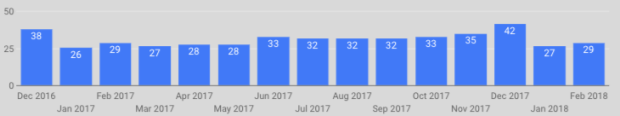
Barchart by month
My second challenge was to convert a text date into a month and year date that Data Studio could interpret.
The text date was, for example, **Dec 2017**. The conversion steps were as follows:
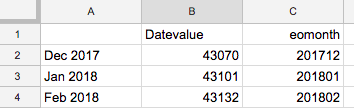
Text to date
Convert the text date (Dec 2017) to a datevalue [=DATEVALUE(A2)]
Extract the end of month value using eomonth [=eomonth(B2,0)]
Finally, format the date again to yyyymm.
This allowed Data Studio to interpret and display the data correctly.
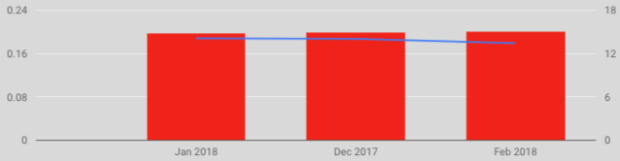
Data Studio chart