
My GP’s surgery, St Paul’s in Winchester, has an adjacent pharmacy and small private car park. It’s always been very busy, but recently I’ve found myself queuing to get a place. It got me thinking – has my surgery actually got busier over the last few years.
Open data
Cue looking for some open data. A Google search took me to:
Numbers of Patients Registered at a GP Practice (practice level, 5 year age groups) on data.gov.uk. It lists data for 5 years.
Confusingly, some datasets are directly downloadable, whilst others are hosted on the NHS Digital Catalogue.
The data sets have unhelpful file names and were not all consistent. Some had the the GP Practice code and postcode, whilst others only had the GP Practice code. Also, at GP Practice level data are released in single year of age bands and 5-year age bands both of which finish at 95+, split by gender and aggregated, but for some datasets I could only find the ‘single year of age’ version.
After downloading the datasets, it was a simple, if tedious, job to use Google sheets to tidy the data and visualise it.
Analyse and visualise
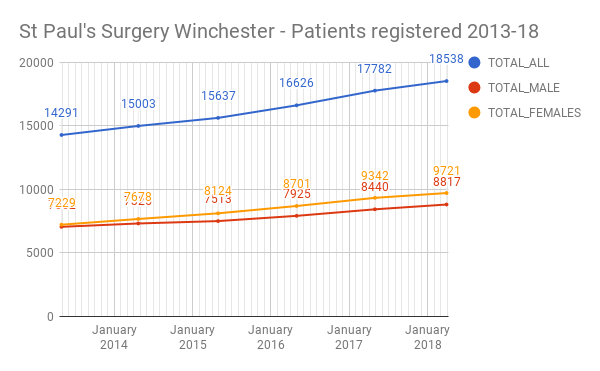
So, my practice has certainly increased its patient numbers, by 29.7% over 5 years, from April 2013 to March 2018.
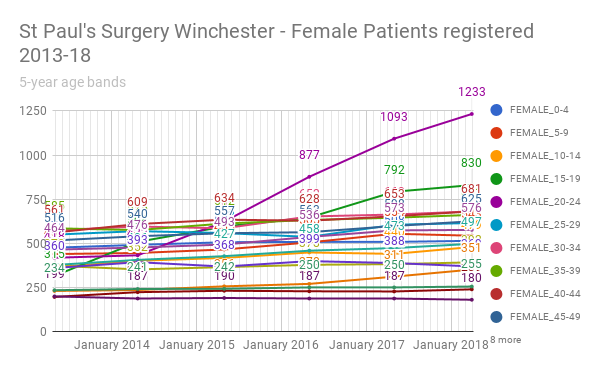
An analysis of the growth across the 5 year bands explained why. Whilst most bands have increased steadily, from 2016 onwards there has been a sharp increase in the number of people in the 15-19 year old and 20-24 year old bands. This is especially marked for females.
| Apr 2013 | Apr 2014 | Apr 2015 | Apr 2016 | Apr 2017 | Mar 2018 | % inc. ’13-’18 | |
|---|---|---|---|---|---|---|---|
| TOTAL_ALL | 14291 | 15003 | 15637 | 16626 | 17782 | 18538 | 29.70% |
| TOTAL_MALE | 7062 | 7325 | 7513 | 7925 | 8440 | 8817 | 24.90% |
| MALE_15-19 | 367 | 430 | 468 | 505 | 565 | 594 | 61.90% |
| MALE_20-24 | 419 | 424 | 454 | 591 | 742 | 843 | 101.20% |
| TOTAL_FEMALES | 7229 | 7678 | 8124 | 8701 | 9342 | 9721 | 34.50% |
| FEMALE_15-19 | 315 | 508 | 595 | 646 | 792 | 830 | 163.50% |
| FEMALE_20-24 | 418 | 432 | 623 | 877 | 1093 | 1233 | 195.00% |
Or visually:
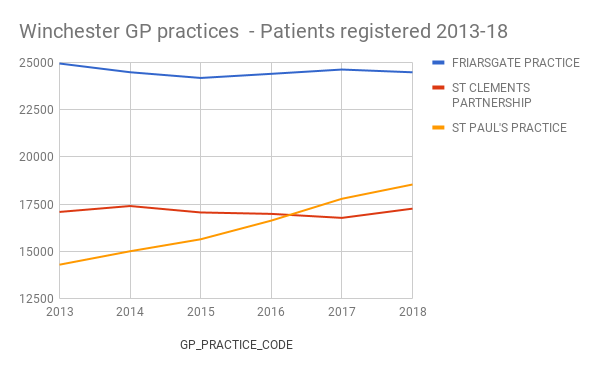
The growth in numbers for these age bands would point to students using the practice. The University of Winchester advises students:
We encourage all our students to register with a GP practice. There are three GP practices in Winchester. These are St Clements Practice, The Friarsgate Practice and St Paul’s Surgery… You can choose to register at any of these GP practices.
However, St Paul’s is the nearest practice to the University and seems to have attracted most students. I haven’t analysed the age band data for the other practices, but the number of patients at the other practices has been essentially constant.
I’d make the assertion that most of the students aren’t driving to the surgery and that the increasing business of the car park is due to the gradually growth in other ages bands at St Paul’s.